Understanding the United States electoral map is crucial for comprehending presidential elections. This detailed guide explains how the electoral college system functions, how electoral votes are distributed among states, and what roles these votes play in determining the next President. Discover how to interpret live election results displayed on an electoral map, identify swing states, and track the path to 270 electoral votes. This resource provides clear insights into the importance of the electoral map for every voter in the U.S., offering practical advice on where to find accurate information and how to make sense of projections. Learn why each state's electoral vote count matters and how this system impacts the overall election outcome. We cover common questions and provide a framework for following election coverage with confidence, ensuring you are well-informed as results unfold. This information helps you understand the bigger picture of national politics and your role within it, empowering you to make informed civic decisions.
- How many electoral votes are needed to win the presidency? - To win the US presidency, a candidate must secure an absolute majority of the electoral votes. This threshold is 270 out of a total of 538 electoral votes. Reaching this number ensures the candidate has garnered sufficient support across various states, aligning with the Electoral College system's design for broad representation.
- What is a swing state on an Electoral Map? - A swing state, also known as a battleground state, is one where voter support for Republican and Democratic candidates is relatively even. The outcome in these states is uncertain, and their electoral votes are crucial for either candidate to reach the 270-vote threshold. Campaigns heavily invest resources and attention in these key areas.
- Are Electoral Maps updated in real time during elections? - Yes, during election nights, major news outlets and election tracking websites typically provide interactive electoral maps that update in real time. As vote counts come in from precincts across states, the map's colors and electoral vote totals for each candidate are continuously refreshed, offering live insights into the election's progress and potential outcome.
- Does the Electoral Map include all types of elections? - No, the term 'Electoral Map' specifically refers to the visual representation of electoral votes for the United States presidential election. It does not apply to other types of elections, such as congressional, gubernatorial, or local races, which are decided by direct popular vote within their respective districts or jurisdictions. It is a distinct tool.
- What if there's an Electoral College tie in an election? - In the rare event of an Electoral College tie, where both candidates receive 269 electoral votes, the House of Representatives decides the election. Each state delegation gets one vote, meaning 26 state votes are needed to win. This unique constitutional provision ensures a resolution, though it is a highly infrequent occurrence in US presidential history.
- Why are some states always red or blue on the map? - Some states consistently appear red or blue on the electoral map because they have historically shown strong, consistent voter preferences for one political party. These are often referred to as 'safe states' or 'solid states' for their respective parties, due to long-standing demographic, cultural, or political leanings. Their outcomes are generally predictable.
- Can the Electoral College system change? - Yes, the Electoral College system can change, but it requires a constitutional amendment, which is a difficult process involving a two-thirds vote in both the House and Senate, followed by ratification by three-fourths of the states. Alternatively, states could adopt the National Popular Vote Interstate Compact, an agreement among states to award their electoral votes to the national popular vote winner.
What is the Electoral Map in US politics?
The Electoral Map visually represents how electoral votes are distributed among US states for presidential elections. It shows which states are projected to vote or have voted for a specific candidate, typically using red for Republicans and blue for Democrats. This map is central to understanding the Electoral College system, which ultimately determines the presidency by requiring a candidate to reach 270 electoral votes.
How does the Electoral College differ from the popular vote?
The Electoral College differs from the popular vote in that it determines the US presidency through state-level electoral votes rather than the total national ballots cast. A candidate needs 270 electoral votes to win, even if they don't win the national popular vote. Each state's electoral votes are based on its congressional representation, with most states awarding all their votes to the popular vote winner within that state.
Which states have the most electoral votes?
States with the largest populations generally have the most electoral votes. As of the most recent census, California has the most electoral votes with 54, followed by Texas (40), Florida (30), and New York (28). These states are often crucial targets for presidential campaigns due to their significant contribution to the 270-vote threshold needed to win the election.
Can the Electoral Map predict election outcomes?
Yes, the Electoral Map can provide strong indications and projections of election outcomes, especially when based on robust polling data and expert analysis. However, it is important to remember that these are predictions, not guarantees. Factors like voter turnout shifts, unexpected events, or polling inaccuracies can lead to discrepancies between projections and final results. It serves as a strong guide.
Where can I find an official Electoral Map?
You can find reliable electoral maps from major, reputable news organizations such as The Associated Press, The New York Times, The Washington Post, and Reuters. These outlets typically offer interactive, continuously updated maps during election season, often with detailed breakdowns and expert analysis. Non-partisan election data aggregators like FiveThirtyEight also provide excellent resources. What is the US Electoral Map and How Does it Work?
The United States presidential election process is complex, and at its core lies the electoral map. This visual representation is more than just a colorful graphic you see on election night; it symbolizes the Electoral College system, a unique mechanism that has shaped American leadership for centuries. For any citizen hoping to understand how their vote contributes to the national outcome, grasping the electoral map is essential. This article will break down what the electoral map means for you, how it functions, and why it remains a central feature of U.S. democracy.
Understanding the Electoral Map System
What exactly is the Electoral Map?
An Electoral Map is a graphical display used in U.S. presidential elections to show the distribution of electoral votes by state and, often, how those votes are projected to be or have been cast. Each state is colored to indicate which candidate is expected to win or has won its electoral votes, typically red for Republicans and blue for Democrats. The map provides a quick visual summary of the national election landscape, helping observers track progress toward the 270 electoral votes needed to win the presidency.
This map is not merely for aesthetics; it is a critical tool for political analysts, news organizations, and the general public. It simplifies complex election data into an easily digestible format. Seeing the states change colors on election night graphically illustrates the real-time shifts in presidential races across the country, highlighting key battleground areas and overall trends. The dynamic nature of the map allows for immediate comprehension of the election's trajectory.
Beyond its visual appeal, the electoral map serves as a practical guide to the Electoral College. It helps to clarify the proportional representation of votes, reflecting the population density and political leanings of different regions. Without this visual aid, understanding the intricate balance of state-by-state victories needed to secure the presidency would be far more challenging for most people. It underscores that winning the presidency requires a strategic approach to securing votes across diverse states.
Why does the United States use an Electoral Map?
The United States uses an Electoral Map because its presidential elections are determined by the Electoral College, not solely by the national popular vote. The Electoral College was established by the Founding Fathers as a compromise between electing the president by popular vote and electing the president by a vote in Congress. Each state is allocated a number of electoral votes based on its total number of representatives in Congress (House members plus two senators). This system ensures that all states, regardless of population size, have a voice in the election, preventing candidates from focusing solely on densely populated urban areas.
This unique system aims to create a balance between direct democracy and federalism. It encourages presidential candidates to build broad coalitions across diverse geographic regions and demographics rather than concentrating their efforts on a few populous cities. The electoral map visually represents this federalist approach, showing how candidates must win specific states to accumulate enough electoral votes to secure the presidency. This means a candidate could win the popular vote nationally but lose the election if they do not achieve the necessary 270 electoral votes through state victories.
The map’s utility extends to strategizing campaigns. Candidates and their teams constantly monitor electoral maps to identify which states are crucial battlegrounds and where their campaign resources should be focused. Understanding the electoral vote distribution on the map helps them tailor messages and appearances to specific state demographics, recognizing that a national popular vote lead might not translate into an Electoral College victory. It is a constant reminder that the path to the White House is a state-by-state conquest.
How are Electoral Votes allocated to each state?
Electoral votes are allocated to each state based on its total congressional delegation: the number of representatives it has in the House of Representatives plus its two senators. For example, a state with 10 House representatives and 2 senators would have 12 electoral votes. The District of Columbia is granted three electoral votes, as if it were a state, under the 23rd Amendment. This allocation is reviewed every ten years following the national census, which can lead to shifts in electoral vote counts for individual states based on population changes.
Most states, with the exceptions of Maine and Nebraska, operate under a winner-take-all system. This means the presidential candidate who wins the popular vote within that state receives all of its allocated electoral votes. This system significantly impacts campaign strategies, as winning even a small plurality of votes in a large state can yield a substantial number of electoral votes. For example, winning California with its 54 electoral votes is a massive prize, even if the margin of victory is slim. Maine and Nebraska, conversely, award electoral votes proportionally or by congressional district.
Understanding this allocation process is vital for interpreting the electoral map. It explains why states with larger populations, like California, Texas, Florida, and New York, hold more sway in the Electoral College. Conversely, smaller states, despite having fewer electoral votes, still play a role, and their cumulative impact can be decisive. The map visually captures this unequal distribution, showing at a glance where the largest pools of electoral votes reside and how they might be influenced by state-specific political contests.
How to Interpret and Use an Electoral Map
What do the colors and numbers on an Electoral Map mean?
On an Electoral Map, the colors typically represent the political party or candidate projected to win or having won a state's electoral votes. Historically, red is associated with the Republican Party, and blue with the Democratic Party. When you see a state colored red, it generally means the Republican candidate has won or is favored to win that state's electoral votes. A blue state indicates the same for the Democratic candidate. These color conventions are widely recognized and instantly convey political leanings across the country.
The numbers displayed on or near each state represent the number of electoral votes that state possesses. These numbers are determined by the state's population, as counted in the most recent census, reflecting its congressional representation. A larger number signifies more electoral power for that state. As election results come in, the total number of electoral votes accumulated by each candidate is tallied and displayed prominently, usually in a running total at the top or bottom of the map. The goal for any candidate is to reach or exceed 270 electoral votes to secure the presidency.
Often, you might see states depicted in shades of purple or gray, or with stripes. These indicate a 'swing state' or 'battleground state' where the race is too close to call, or where the outcome is uncertain. These are the states where presidential campaigns typically invest the most time and resources, as their electoral votes are critical and can determine the election's final result. Understanding these visual cues allows you to quickly assess the current state of the election and identify the key areas still in contention.
How can I track election results using a live Electoral Map?
Tracking election results with a live Electoral Map is a dynamic and engaging way to follow election night. Most major news organizations and election tracking websites provide interactive maps that update in real-time as votes are counted. To use one effectively, begin by familiarizing yourself with the electoral vote count for each state. Pay close attention to states marked as 'swing states' or 'battleground states,' as these are often the most unpredictable and crucial to the outcome. As votes are tallied within these states, watch for shifts in their color or the percentage indicators that show which candidate is leading.
As results are reported, the map will update, changing state colors from undecided to red or blue. Concurrently, the running total of electoral votes for each candidate will climb. The magic number to watch is 270 – that's the threshold for victory. Many live maps also offer additional features, such as breakdowns of votes by county within a state, historical data for previous elections, and projections from various polling models. These features provide a deeper understanding of trends and potential outcomes. Keep in mind that initial results can sometimes be misleading, so it is best to observe the overall trend as more precincts report.
To get the most accurate information, rely on reputable news sources and non-partisan election data aggregators. Websites like the Associated Press, New York Times, Washington Post, and election-specific sites provide robust, continually updated electoral maps with expert analysis. Avoid relying solely on social media for live updates, as information can be unverified or inaccurate. By using reliable sources, you can confidently track the election's progress and understand the narrative unfolding on the map. This proactive approach helps in discerning true shifts versus temporary fluctuations.
What common mistakes should I avoid when reading the Electoral Map?
When interpreting an Electoral Map, a common mistake is equating the popular vote winner with the Electoral College winner. Remember, the U.S. presidency is decided by electoral votes, not the national popular vote total. A candidate can win the popular vote by millions but still lose the election if they do not secure the necessary 270 electoral votes through state-by-state victories. This disconnect is a fundamental aspect of the American system and can be a source of confusion if not properly understood. Always focus on the electoral vote count rather than just the raw number of ballots cast nationwide.
Another frequent error is assuming early returns predict the final outcome, especially on election night. Early vote counts often come from specific geographic areas, which may lean heavily towards one party. For instance, rural areas might report first, favoring one candidate, only to be balanced out later by urban area counts. It is important to be patient and wait for a significant portion of votes to be counted across diverse regions within a state before making conclusions. Election results can shift dramatically over several hours or even days, particularly in close races or states with extensive mail-in voting processes.
Finally, avoid letting personal biases or preferences influence your interpretation of the map. Look at the data objectively. Focus on the electoral vote totals, the number of votes needed to win, and the states still in contention. Over-reliance on partisan news sources without cross-referencing can also lead to a skewed understanding of the map's implications. For accurate and balanced insight, consult multiple reputable sources and recognize that projections are not guarantees. A critical and patient approach will lead to a more informed understanding of the election's unfolding narrative.
Making Sense of Your Vote and the Electoral Map
How does my individual vote influence the Electoral Map?
Your individual vote plays a direct, albeit localized, role in shaping the Electoral Map. In most states, the candidate who wins the popular vote in that state receives all of its electoral votes. Therefore, your vote contributes to the statewide popular vote total, which then determines how that state's electoral votes are allocated on the national map. While one vote alone cannot swing a state, collectively, millions of individual votes decide the outcome in each state, ultimately contributing to the final electoral count. This means every ballot cast helps build the state's majority.
Consider the impact in swing states or battleground states. These are states where the popular vote margin between candidates is typically very close. In such states, every single vote, including yours, carries significant weight because a small shift in voter turnout or preference can flip the state from one party to another on the electoral map. A change of just a few thousand votes in a highly contested state can alter its color on the map and potentially change the outcome of the entire presidential election. This highlights the strategic importance of voting in states where the race is tight.
Even in states that consistently vote for one party, your vote still matters. It contributes to the overall popular vote total and reinforces the mandate of the winning candidate, or it registers dissent. High voter turnout, regardless of the state's historical leaning, strengthens democratic participation and demonstrates civic engagement. Therefore, while your vote directly impacts your state's contribution to the electoral map, its broader significance lies in its role in a collective democratic process, signaling the will of the people within your specific region.
Where can I find reliable Electoral Map projections and analysis?
For reliable Electoral Map projections and analysis, turn to established and non-partisan news organizations and academic polling aggregators. Major news outlets like The Associated Press, Reuters, The New York Times, The Washington Post, and The Wall Street Journal typically offer robust and continuously updated electoral maps with detailed analysis from political scientists and experienced journalists. These sources often have dedicated election desks that meticulously track polling data, campaign events, and demographic shifts to provide informed projections.
Beyond traditional media, specialized polling analysis websites are excellent resources. Sites such as FiveThirtyEight, RealClearPolitics, and Cook Political Report are known for their sophisticated statistical models that aggregate polls from various sources and offer probabilities for state and national outcomes. These platforms usually explain their methodologies, allowing users to understand the basis of their projections. They are valuable for seeing beyond simple poll numbers, providing a deeper dive into the potential electoral landscape as it evolves throughout the campaign season.
When consulting these resources, it is wise to compare projections from several different sources. While all reputable outlets strive for accuracy, their models and interpretations can vary slightly. Looking at a range of analyses helps you form a comprehensive view and avoids over-reliance on a single prediction. Pay attention to how frequently the maps are updated and whether the analysis addresses key factors like undecided voters, historical turnout, and recent events. This diligence ensures you are viewing the most current and well-reasoned forecasts available, helping you navigate the electoral map with confidence.
When should I consult an Electoral Map during election season?
You should consult an Electoral Map throughout the entire election season, not just on election night, to gain a comprehensive understanding of the presidential race. Early in the campaign, typically months before the election, the map will show initial polling data and expert projections. This is when you can identify 'safe' states for each party and crucial 'swing states' where the outcome is uncertain and campaign efforts will be concentrated. Consulting the map at this stage helps you track the overall strategic landscape and anticipate key battlegrounds. It offers a framework for understanding campaign visits and spending.
As the election draws closer, particularly in the weeks leading up to Election Day, the electoral map becomes more active with updated polling data and revised projections. This period is critical for understanding momentum shifts and how major campaign events or debates might be influencing voter sentiment in key states. Watching how states change from 'lean' to 'toss-up' or firmly in one column provides insights into the tightening or widening of the race. This continuous monitoring helps you stay informed about the most current probabilities and potential outcomes as Election Day approaches.
Of course, election night itself is when the electoral map truly comes alive. This is when real-time results are tallied and states begin to officially declare their electoral votes. Consulting a live electoral map on election night allows you to track the accumulating vote counts for each candidate, watch states turn red or blue as results solidify, and monitor the race to the critical 270 electoral votes. It is the definitive moment when all the projections and analyses culminate in concrete outcomes, offering the most direct understanding of who is winning and how they are achieving it. This real-time view helps you follow the exciting, often unpredictable, conclusion of the presidential race.
US electoral map explained, how electoral votes are allocated, understanding presidential elections, tracking election results, electoral college system basics, state by state election outcomes


2026 House Election Interactive Map 270toWin 257JNJM . United States Midterm Election 2026 The Year 2026 IMG 4624.webp. Archivo 2026 United States House Of Elections 3840px 2026 United States House Of Elections Retirements Or Losses Of Map.svg . Introducing The 2026 Senate Interactive Map 270toWin Senate Incumbent . 2026 State Elections Could Reshape Trifecta Control States To Watch Upload Fcc446


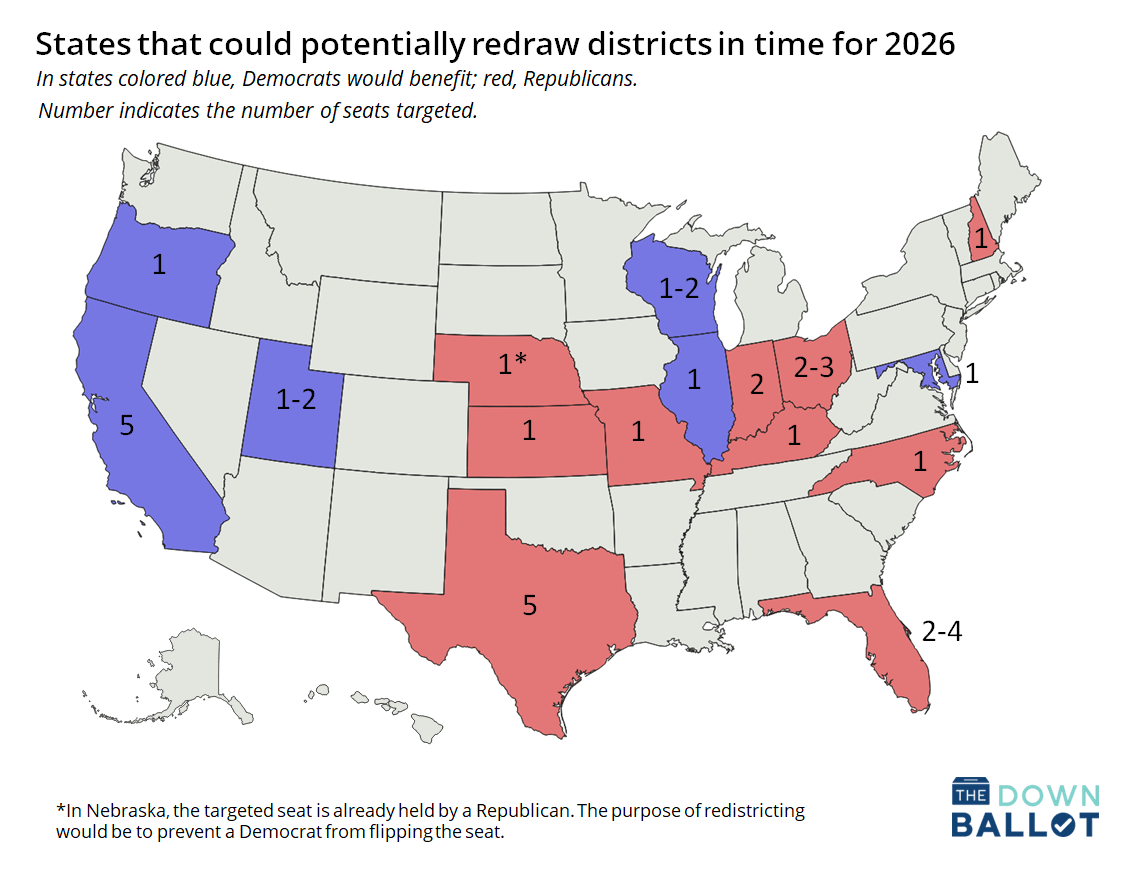

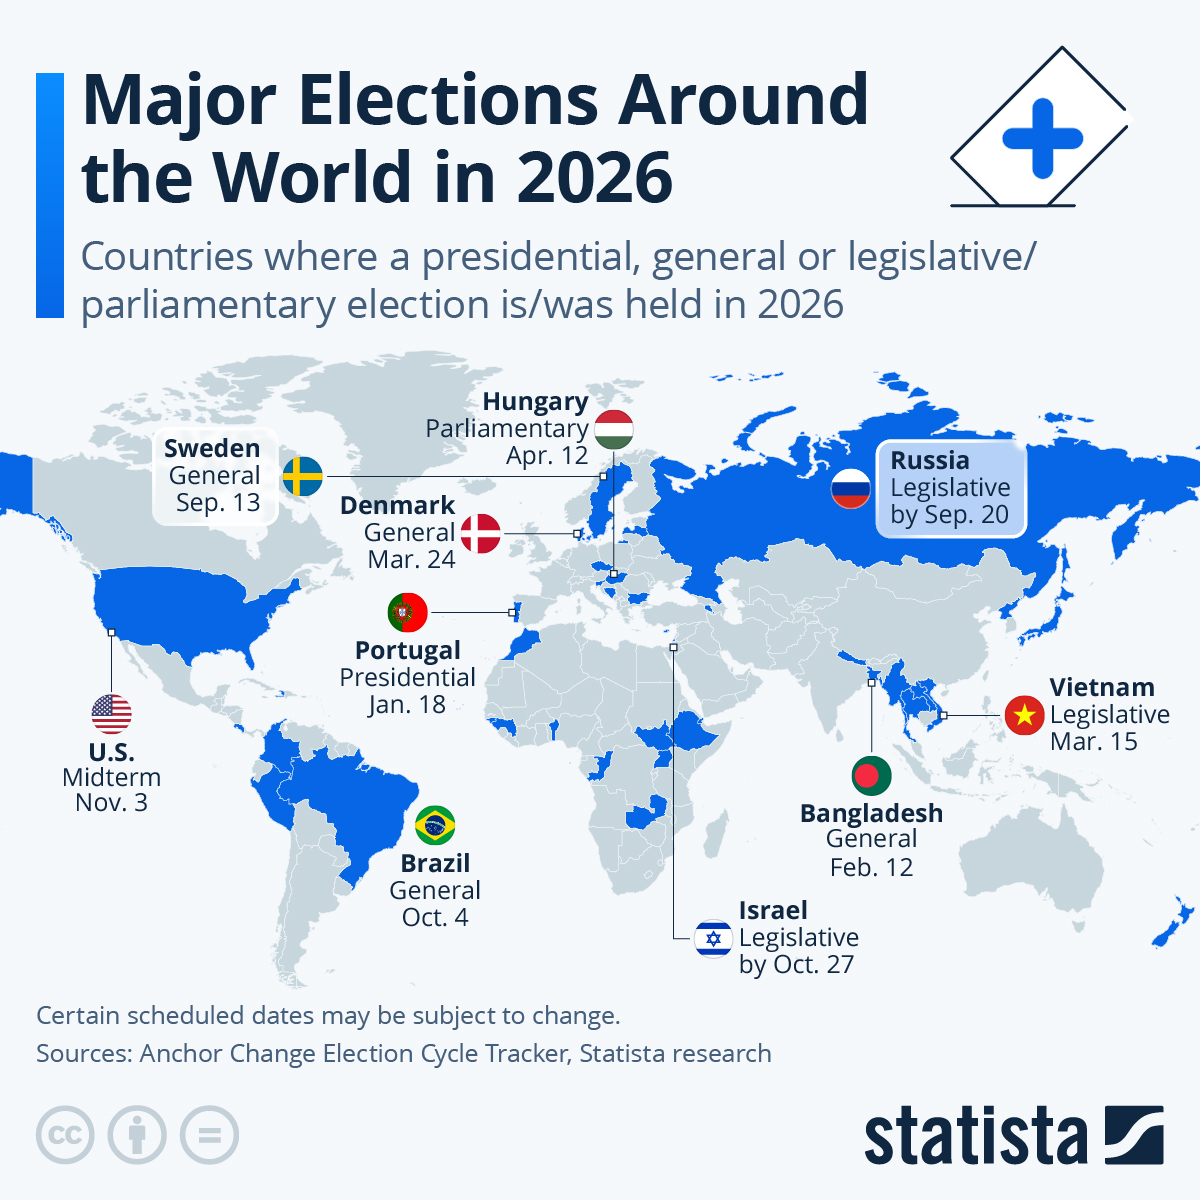
Whats The True Weight Of Americas System Governor 2025 26 Incumbent . Interactive World Map Maphover Interactive Electoral Map Electoral Map Full . Here S Every State That Could Draw A New House Map By 2026 Dc118afa A9e4 454b 8e56 1144x872 . 2026 Governor Election Forecast Maps 270toWin Consensus 2026 Governor Forecast. Chart Where Major Elections Will Be Held In 2026 Statista 35991


2026 Midterm Election Map State Districts State Election District Map Preview Image 1536x864 . File 2026 United States Senate Elections Retirements Map Svg Wikipedia 960px 2026 United States Senate Elections Retirements Map.svg . Live US Election 2024 Results Track Electoral Votes B5d29cd9 C43e 4e8d 842d 1920x1080 . Walz Says He Will Protect Minnesota In First Speech Since Trump Win 2026 Senate Elections . Us Senate Elections 2026 2026 Senate Map


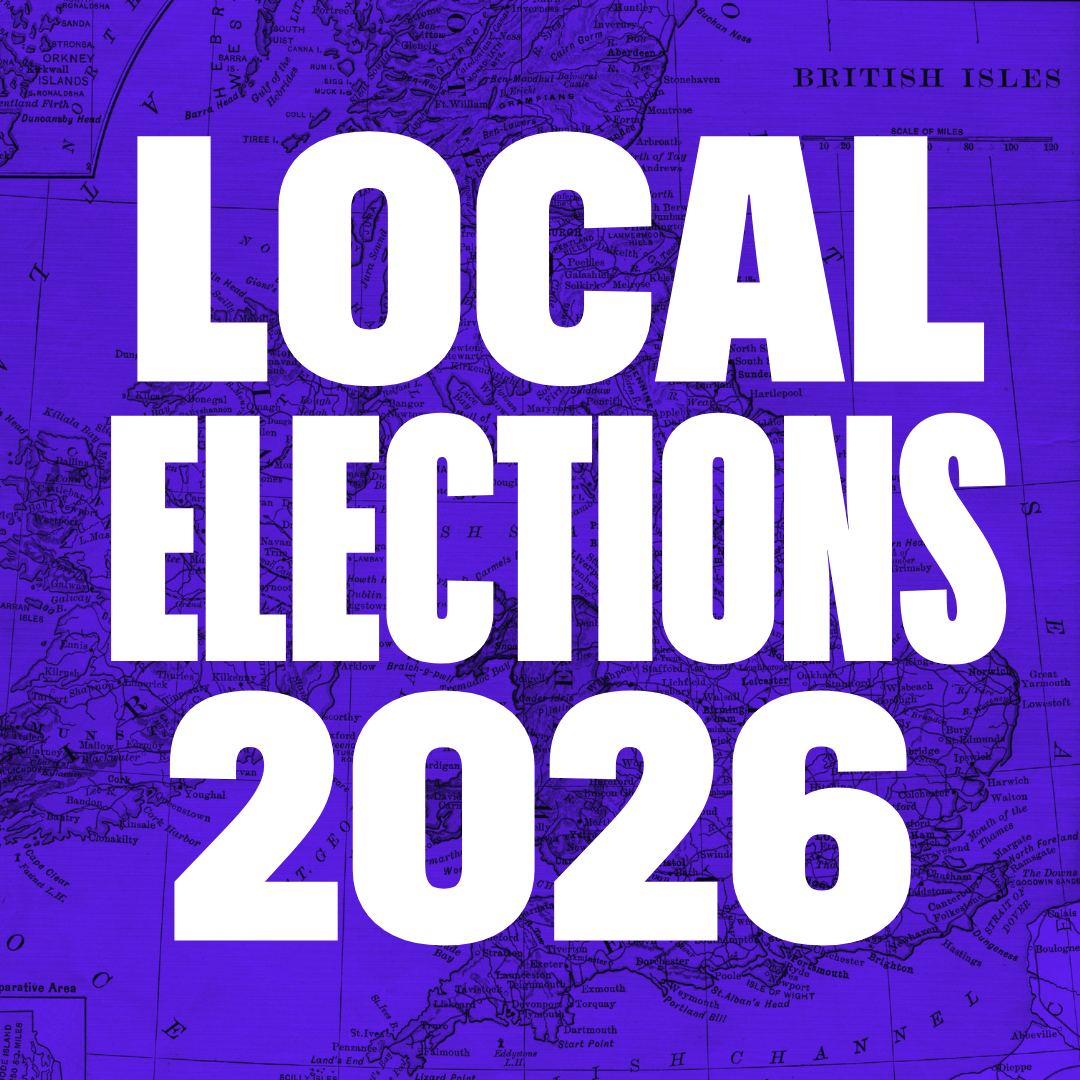

How To Select The Perfect Map In 2026 For Your Needs . Beyond Stalin And Mamata The 5 High Stakes Election Battles That Will Assembly Election 2026 . Election Explorer 2026 Map MWM 7ffdd35c C2a3 496e B0e9. 2026 Local Elections Compass OUR . 2026 Elections The Results In Maps And Charts Yahoo News UK


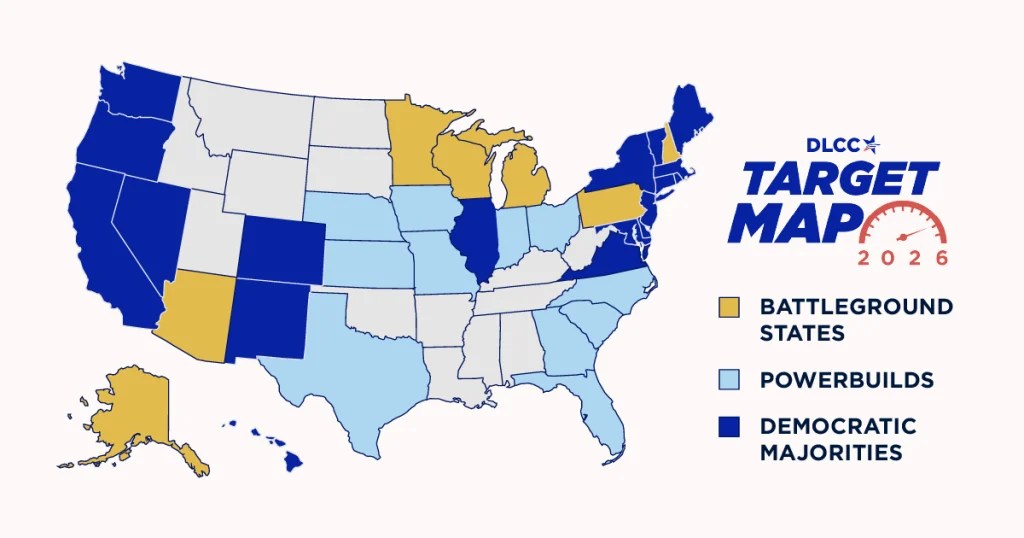


Introducing The 2026 Senate Interactive Map 270toWin Blank 2026 Senate Map . 2026 US Election A Patriotic Map And Symbolism Of Us Election Patriotic Map Symbolism American Democracy Future Elections Us Election Patriotic 365293833 . How To Select The Perfect Map In 2026 For Your Needs 2026 Expanded Target Map Web Inline 1024x538 . Electoral Map Leaves Liberals With Uphill Task For 2026 State Election Screen Shot 2024 12 12 At 3.07.12 Pm . 2026 Elections The Results In Maps And Charts Yahoo News UK


Election 2026 Stock Photos Free Royalty Free Stock Photos From Us Election Map States Politics Voting Democracy Polling Candidates Campaign Key Info Race White House Usa 365272809 . File 2026 United States Secretary Of State Elections Map Svg 960px 2026 United States Secretary Of State Elections Map.svg . May 2026 Elections Results In Maps And Charts Yahoo News UK. File 2026 Bangladesh General Election Alliance Wise Result Map Svg 500px 2026 Bangladesh General Election Alliance Wise Result Map.svg . Georgia Senate 2026 Election Polls And Predictions Jon Ossoff Re Senate Map 26 4



The 2026 Election Map Based On SHOCKING New Polls YouTube . Which States Have The Most Electoral Votes The 2026 Power Map Electoral College Map GETTY . 2026 Midterm Election Map State Districts Infographic Election Map Preview Imag Ae . How To Select The Perfect Map In 2026 For Your Needs . Fights And Electoral Math Are Setting Up A 2026 Midterm Undefined Jan 23 2026 09 59 54 6920 PM